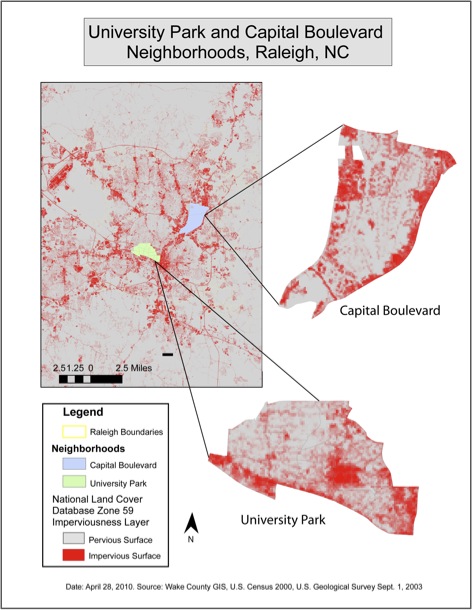
Figure 1: Urban Neighborhoods
The following is an excerpt from a paper written by Megan E. Culler as part of a workshop course at UNC-Chapel Hill's Department of City and Regional Planning.
Impervious surface is surface such as pavement or rooftops that prevents the infiltration of water. High levels of impervious surface can contribute to degraded water quality and increased flood risks by increasing runoff and reducing the opportunity for watersheds to filter water. According to some researchers, as little as 10% imperviousness can lead to impairment of a watershed (Schueler, 1994). A 2006 study by the EPA demonstrated that compact development can effectively protect resources by preserving "large, continuous areas of open space," preserving areas critical to watershed ecology, and reducing land disturbance and impervious surface (Richards, 2006). This study demonstrated that while high-density development might have more impervious surface and thus a greater impact on watersheds per square mile, it decreased impacts and impervious surface per dwelling unit (Richards, 2006). However, our analysis of local neighborhoods showed an even greater reduction in neighborhoods that embodied Reality Check principles: not only did these neighborhoods have lower per capita and per dwelling unit impacts, they also had a lower impervious surface level per square mile of land. These findings suggest that Reality Check principles could greatly reduce burdens on the region's water resources.
I used different methodology and data sources to calculate impervious surface for the three pairs of neighborhoods based on the availability and quality of data. Because the purpose of this part of the study was to compare impervious surface cover between neighborhoods that resembled what would be built under the "baseline scenario" or the Reality Check scenario, rather than to draw comparisons between urban, suburban, and rural neighborhoods, the different methodologies should not be a concern.
I used National Land Cover Database Zone 59 Imperviousness Layer data from the U.S. Geological Survey to calculate the amount of pervious and impervious surface in each neighborhood in square feet. (See Figure 1: Urban Neighborhoods).
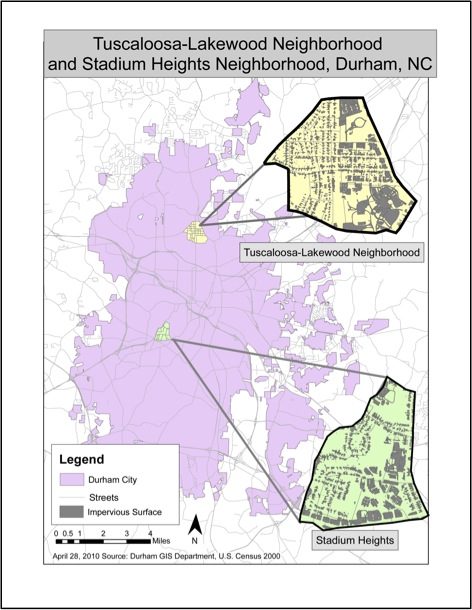
The two suburban neighborhoods, Tuscaloosa-Lakewood and Stadium Heights, showed no impervious surface according to the National Land Cover Database Impervious Layer. Since this is not possible, a likely explanation is that because the data was created through remote sensing, tree cover might have disguised impervious surfaces in this area. Therefore, the impervious surface data came from a polygon shapefile from Durham's GIS department showing impervious surfaces in Durham. This shapefile combined includes both building footprints and paved surfaces. (See Figure 2: Suburban Neighborhoods).
I was not able to compare the results of the two rural neighborhoods, Briar Chapel and Windfall, as data on building footprints and road widths were not yet available. The USGS National Land Cover Database layer was also not applicable because it dated from 2006; these two neighborhoods were not yet completed at that date.
For each neighborhood, I calculated the total impervious surface in feet, the impervious surface per capita, and the impervious surface per dwelling unit. The results confirmed that neighborhoods designed in a way that corresponds with Reality Check principles such as compact development, density, and mixed use produced far less impervious surface per capita and per dwelling unit than neighborhoods that more closely resembled business as usual, with sprawling, low density land uses, low street connectivity, separated uses, and orientation toward autos. The tables below illustrate these findings:
| Percent Impervious Surface | ||
|---|---|---|
| Baseline | Reality Check | |
| Urban | Capital Boulevard | University Park |
| Impervious surface | 58.01% | 24.48% |
| Permeable surface | 41.99% | 75.52% |
| Suburban | Stadium Heights | Tuscaloosa-Lakewood |
| Impervious surface | 23.50% | 21.82% |
| Permeable surface | 76.50% | 78.18% |
Not only was the percent impervious surface dramatically lower for the entire neighborhood, but also the square footage of impervious surface was lower per capita and per dwelling unit in the neighborhoods that fit the Reality Check scenario.
| Impervious Surface Per Capita and Per Dwelling Unit | ||
|---|---|---|
| Baseline | Reality Check | |
| Urban | Capital Boulevard | University Park |
| Total Population | 9069 | 9112 |
| Square feet of impervious surface per capita | 5068.77 | 1449.69 |
| Total housing units | 3942 | 4568 |
| Square feet of impervious surface per housing unit | 11661.25 | 2891.77 |
| Suburban | Stadium Heights | Tuscaloosa-Lakewood |
| Total Population | 1306 | 1383 |
| Square feet of impervious surface per capita | 3045.53 | 1551.06 |
| Total housing units | 475 | 667 |
| Square feet of impervious surface per housing unit | 8373.6 | 3216.07 |
In fact, impervious surface per capita and per dwelling unit in the Reality Check scenario neighborhoods was a small portion of what it was in the baseline scenarios. The table below illustrates this large difference by showing the amount of impervious surface in the Reality Check neighborhoods expressed as a percentage of the impervious surface in their matched baseline neighborhoods.
| Impervious Surface in Reality Check Scenario As a Percentage of Impervious Surface in Baseline Scenario | ||
|---|---|---|
| University Park | Tuscaloosa-Lakewood | |
| Square feet of impervious surface per capita | 28.60% | 50.93% |
| Square feet of impervious surface per housing unit | 24.80% | 38.41% |
The comparison of these two sets of neighborhoods demonstrates that development along the lines encouraged by the Reality Check principles has the potential to dramatically reduce impervious surface in the region, perhaps by as much as 50-75%.
Figure 1: Urban Neighborhoods
Figure 2: Suburban Neighborhoods
Schueler, T. (1994). "The importance of imperviousness." Watershed Protection Techniques, 1(3), 100- 111
U.S. Geological Survey. (9/1/2003). National Land Cover Database Zone 59 Imperviousness Layer Edition: 1.0 (remote-sensing image). Sioux Falls, SD: U.S. Geological Survey
Richards, L. (January 2006). Protection Water Resources with Higher-Density Development. Washington, D.C.: United States Environmental Protection Agency.
U.S. Census Bureau. (2000). Summary File 3.
U.S. Census Bureau. (2000). TigerLines shapefile.
Home